Pause an isolated editor test before a command runs, move through it one step at a time, and inspect its recorded outputs. Use this to find where a calculation or decision begins to differ from what you expected.
Open a server function, endpoint or event and choose Test.
Choose one test and supply its inputs as usual. Turn Use live data off.
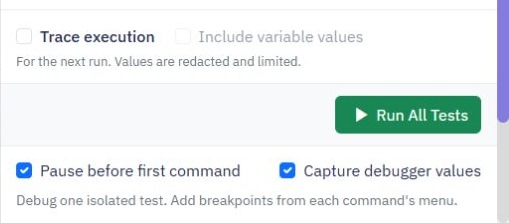
Leave Pause before first command selected to stop at the beginning. You can also set breakpoints on individual commands before starting.
Leave Capture debugger values selected to inspect safe output previews as you step. Turn it off before starting if values are unnecessary.
Choose Debug test. The Live debugger opens and prepares a private test run.
Debugging runs one test at a time. Run All Tests and client functions are not supported. An ordinary Run Test still runs to completion; it does not pause at breakpoints.
Debugger value capture starts enabled and is separate from the ordinary test's Include variable values tracing option. Changing one does not change the other.
Use Add breakpoint in a command's menu, or its circular breakpoint button, to mark a place to inspect. Use Remove breakpoint to unmark it. The test panel also offers Clear breakpoints for the current workspace. A breakpoint pauses before a command executes, so its new output will not yet be present. Breakpoint changes apply to the next debug run, not the run already in progress.
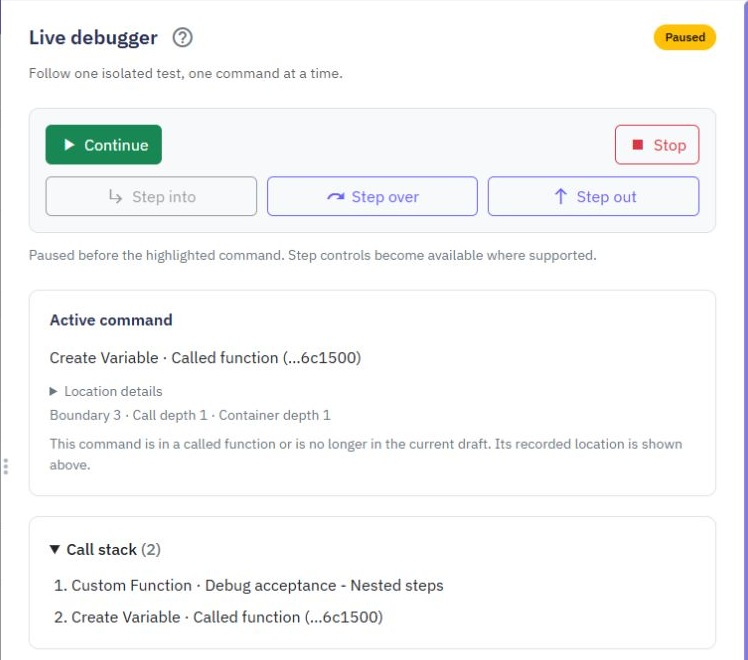
Active command identifies the next command. Locate command scrolls to the highlighted command, or focuses its node in Workflow view, when it belongs to the open workflow. A called function's location can still appear in the call stack even when that function is not open in your editor.
Called functions use their published version. Older published functions can still be stepped through by command position; republish the called function before setting breakpoints inside it. If a breakpoint no longer matches a test definition, use Clear breakpoints or republish the called function, then start a new debug test. The debugger does not guess a match from an unpublished draft.
Continue runs until the next breakpoint or the end.
Step into enters the current called function or container and pauses at a command inside it. It is unavailable when the current command has no commands to enter.
Step over runs the current command and its children, then pauses at the next command outside it.
Step out finishes the current function call and pauses after returning to its caller.
Stop requests that the debug run end.
Stepping buttons are enabled only when the run is paused and that action is available. Step out requires a called function to return from, so it is disabled at the top level. Step over can finish the run when there is no following command. While an action is being processed, wait for the next pause before choosing another step.
Step into is offered when a command contains enabled child commands. A condition may choose an empty branch, or a loop may have no iterations; in those cases it can continue to the next command without pausing inside.
A breakpoint can pause a run during stepping. Loop iterations may revisit the same command; the boundary number helps distinguish those visits.
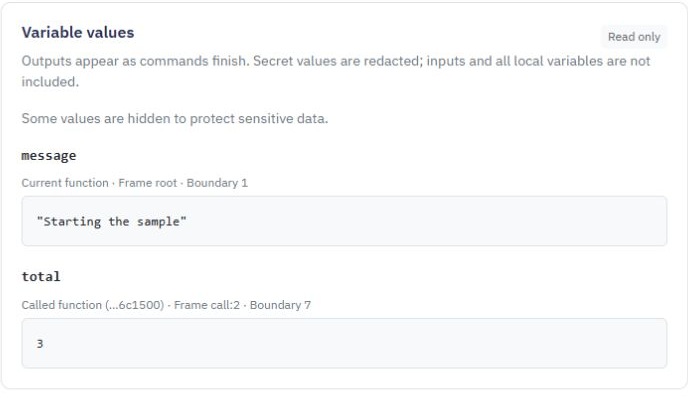
Variable values shows read-only previews of recorded variable outputs captured so far, updating as commands finish. A pause occurs before the next command runs, so the values belong to commands that have already completed. Location details identify the function, frame and boundary where an output was recorded. These are recorded outputs, not a complete view of every current variable or input. An earlier function's output may remain visible after that function returns.
Previews are limited in size and sensitive values are redacted. Secret values and full request data are not shown. If Capture debugger values was off, start a new debug run with it enabled to collect safe previews. You cannot edit variables or run arbitrary expressions in the debugger.
Repeated assignments update the latest captured value for that variable in its function frame. Some outputs, including protected function-call results, may be omitted while other safe values remain visible. The panel explains when privacy rules hide outputs; an omitted value does not mean the command failed to run.
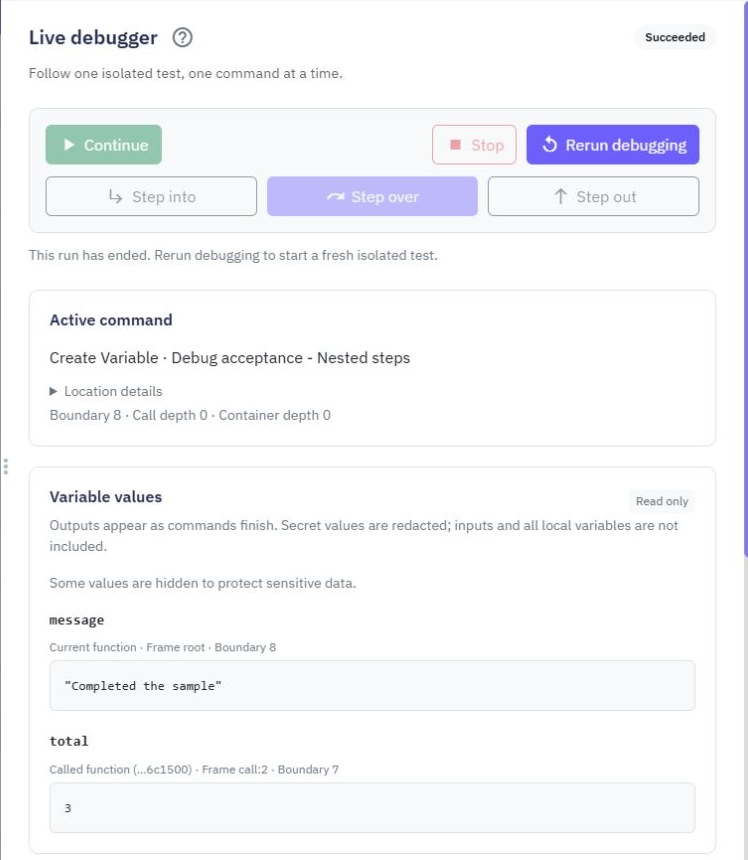
When a run finishes, review Result, Run error, its last captured values and execution trace. A failed run can help you identify the last command reached.
Choose Rerun debugging after completion, failure, Stop or expiry to start a fresh isolated run with the same test inputs. It uses the current workflow definition and breakpoint preferences. The previous run is not resumed, and the new run has its own time limits. Choose Back to tests to select different inputs or change debugger value capture first.
Reconnect checks the original run when its connection is uncertain. Wait until the original run's outcome is known before starting again.
Debug trace timings show execution time and exclude time spent paused. A stopped, expired or interrupted run may not have a complete trace; its last recorded location can still help you understand where it stopped.
This first version supports isolated tests of supported server commands. External actions, file operations, shared cache, realtime, background jobs, streams, external database connections and transactions are unavailable during debugging, including inside called functions. If a test contains an unsupported action, remove that action from the test workflow or test it separately using the usual test controls.
A debug run uses private test data. Stopping a run does not undo actions performed by other workflows or ordinary tests. Changes to a workflow after debugging starts do not change that run's captured definition.
Keep the debugger open while testing. Closing it requests Stop. A lost connection expires after about 20 seconds without a successful refresh. An individual pause lasts up to 30 seconds, and the whole session lasts up to three minutes. Actual command execution is limited to 30 seconds or your existing, shorter test limit. Pausing does not reset those limits.
Only a small number of sessions can run at once to keep testing responsive for everyone. If a limit is reached, stop your existing run or try again shortly. Reconnect checks the same run when its connection is uncertain; it does not deliberately start a second execution.
For a completed run without pauses, see Testing.
Inputs
Overview. In Twidget, inputs are essential elements that allow you to configure endpoints and functions. Events do not use inputs. Endpoint Inputs. Endpoint inputs are used to retrieve data from requests. The available types of endpoint inputs are: 1. Path: Variables that are part of the URL path. 2...
Reusable Middleware
Middleware is a reusable workflow that runs before or after an endpoint, function or event. Build it once, then apply it wherever you need the same input checks, response formatting or logging. Create middleware. Open Middleware from the sidebar and choose Create Middleware. Give it a clear name, su...
Variables
Variables are essential building blocks in Twidget that allow you to store and manipulate data dynamically within your no-code applications. They enable you to create flexible and interactive applications by holding values that can be changed and referenced throughout your workflow. Creating Variabl...
Output
Each function also has an optional output where you can return an output variable. To simplify the use of functions, you can define an output schema. The output schema acts as an internal documentation detailing what the output of the function will look like. This makes it easier to understand and u...
Test suites
Test a customer journey across several endpoints in a single ordered run. For example: sign in, create an order, retrieve it, then check its status. Every run shares its own isolated database across its steps. Your workspace records are not changed by those database actions. This version supports is...