Open Logs & Insights from the sidebar to investigate recent workflow calls, find recurring errors and follow covered changes in the current workspace. The five tabs are Request history, Errors, Performance, Audit and Log messages.
Monitoring history is retained for 30 days. Its counts describe retained runs; use the Dashboard for your organization's plan usage and allowance. If your plan does not include monitoring, choose View plans from the page. Your existing log-message view remains available as before.
The page initially shows Live calls from the Last 24 hours, newest first. Change Calls to Test calls when investigating workflow tests, or Live and test calls to include both. Test calls are recorded separately from live calls; running a custom function from its test panel appears as a function test.
Choose Last 7 days, Last 30 days or Custom dates. Custom dates use the time zone displayed below the fields. From includes that moment; To (exclusive) stops just before the selected end time. For example, to review yesterday, choose yesterday at midnight through today at midnight. Choose a window within the last 30 days that ends now or in the past.
Choose a Workflow type, enter part of a route or workflow name in Search workflow, then select Apply filters. Reset returns to the initial date and live-call choices. Refresh reloads the current view.
Open More filters to narrow results by success or error, HTTP method or status code, timeout, duration, trace ID or workflow ID. Durations use milliseconds: 1,000 ms is one second. A minimum duration of 1,000 helps find slow calls. HTTP filters apply to calls that have matching HTTP details.
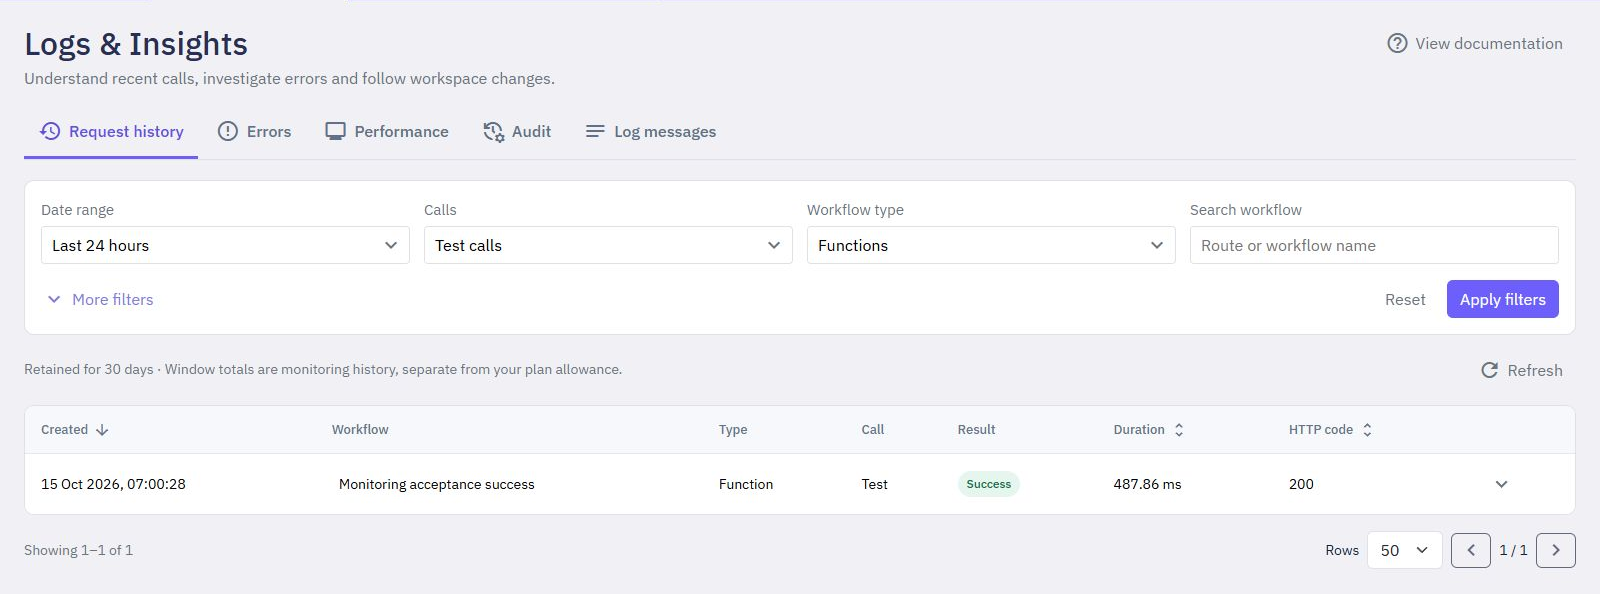
This example filters to Test calls and Functions. The Created arrow shows newest-first sorting.
Request history shows when a run started, its workflow, whether it was live or a test, result, duration and available HTTP status code. A timed-out run is marked Timed out. Function tests can fail even when the test request itself returned HTTP 200, so check Result as well as the HTTP code.
Select Created, Duration or HTTP code to sort. Select the heading again to reverse the order; the arrow shows the direction. Change Rows or use the previous and next buttons to move through matching results.
Use a row's details arrow to open Run details. Available details include the run and trace IDs, error information, timeout duration, execution location and command timings. Open workflow returns to a linked workflow when it is still available.
Each Run ID identifies an individual recorded run. A Trace ID connects related activity and messages; a triggered event can share a trace with the workflow that started it. An available parent-run ID shows that relationship.
Endpoint routes show the saved route pattern, such as /orders/{id}, rather than the customer's actual parameter. Older or unmatched calls may have a neutral label. History does not provide request or response bodies, headers or variable values. Error messages can still contain business details, so avoid putting private information in your own errors.
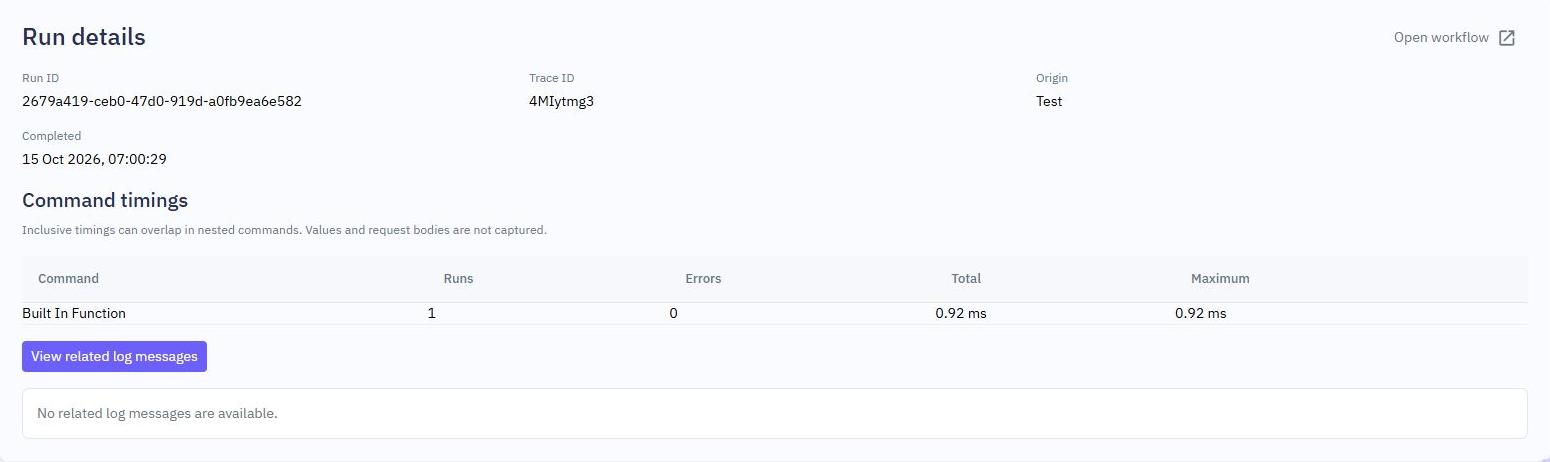
Expand a run to inspect its IDs and available command timings. This isolated test has no retained related messages.
Choose View related log messages in the run details to see up to 100 available related message summaries. If no messages appear, the run may not have produced any, or the messages may have expired. Shared traces can include related workflow activity.
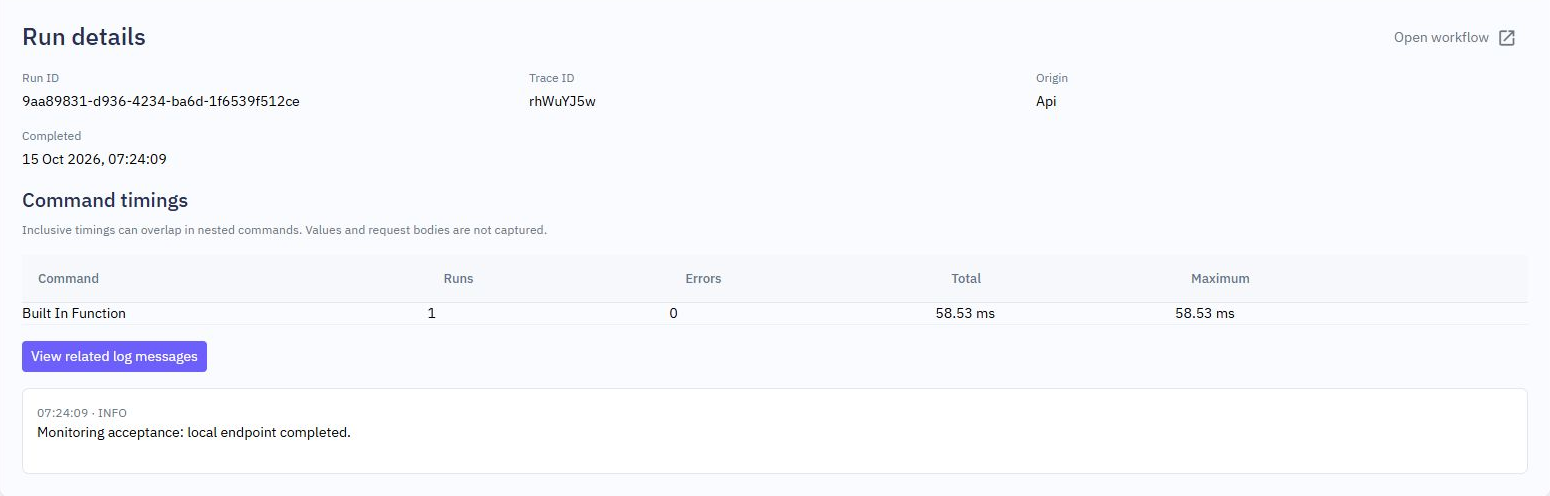
This live endpoint run includes the INFO message written by its Log command.
For command-by-command test review and optional limited variable values, use Execution tracing in Testing. Monitoring does not pause workflows or replay a recorded call.
Errors groups failures from the same workflow with matching error code, type and execution location. Different error messages do not necessarily create different groups. Live and test failures remain separate groups.
Each group shows occurrence count and first and last seen times within the selected window. Sort by Occurrences for frequent failures, or Last seen for recent ones. View latest run opens the matching request-history view so you can inspect details.
The group states help you track your investigation:
New means the group is awaiting attention.
Fixed means you selected Mark fixed after addressing it. This records your decision; it does not repair the workflow or remove earlier failures.
Regression means another matching failure occurred after the group was marked fixed.
Ignored means you selected Ignore. It remains ignored when it recurs until you choose Reopen.
Use Error state to focus on a state, such as New or Regression. Reopen returns a Fixed or Ignored group to New. These decisions leave the original history and performance counts intact.
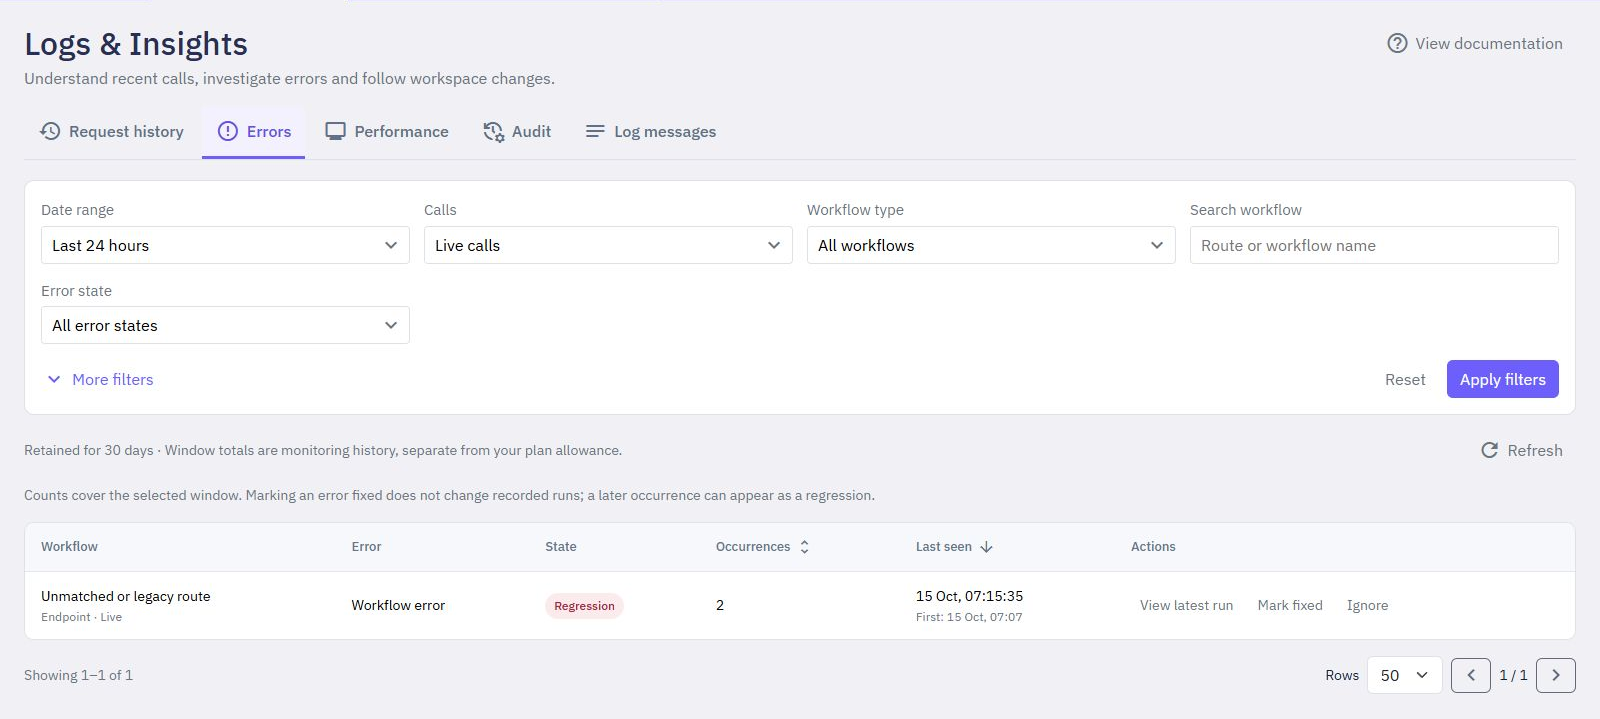
A repeated failure appears as Regression after another occurrence. Its earlier runs remain in the history.
Performance uses all retained calls matching your filters and date window, rather than only the current history page. It shows call counts, success rate, errors, timeouts, average duration and maximum duration. The chart shows calls and errors over time.
P50 duration is the middle duration: approximately half of measured calls completed at or below it. P95 duration helps identify slower calls: approximately 95% completed at or below it. These values use valid recorded durations. When more than 5,000 are available, the page labels them as sampled from the latest 5,000 durations. Counts, average and maximum still cover the full matching window.
Workflow performance lists up to 100 workflows with the greatest total duration. A workflow can appear because it is slow, runs frequently, or both. Compare its call count, average, total and maximum before choosing what to improve.
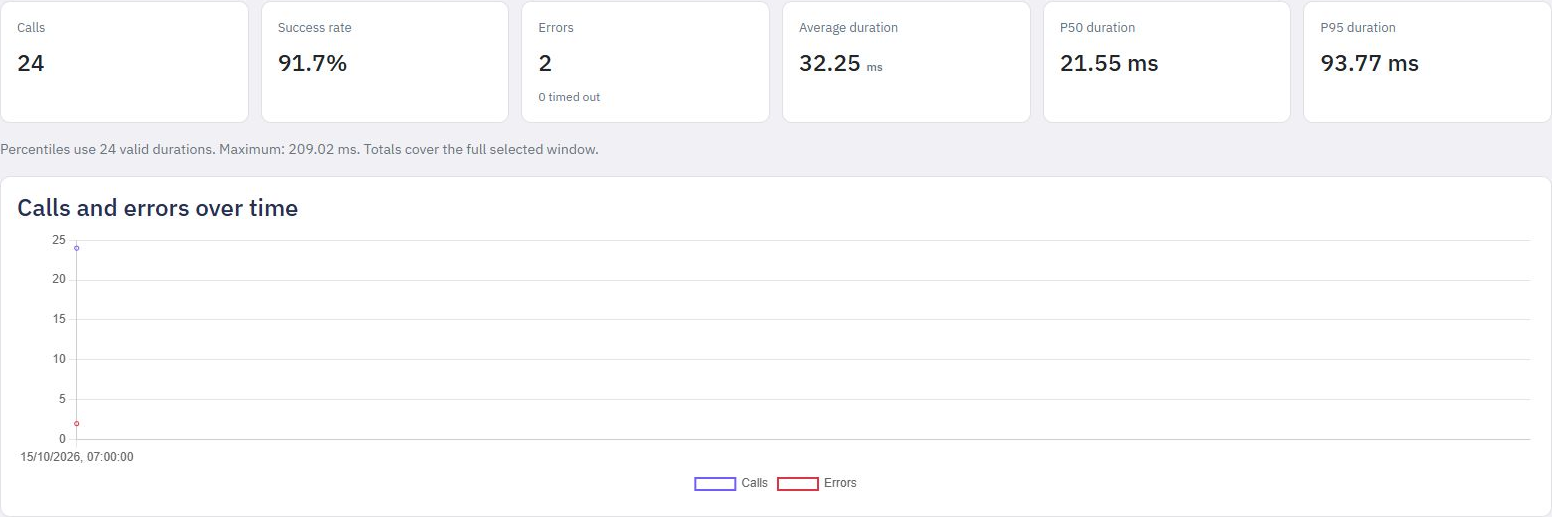
Compare calls, errors and response times for the selected window. The note below the cards explains which durations contributed to the percentiles.
Command categories combines available timings for command types, such as Get Data or Custom Function. Timings include time spent in nested commands. For example, a loop lasting 100 ms can also contain child commands lasting 80 ms; adding both would count some time twice. The categories are helpful comparisons, not percentages of total workflow time.
Timing capture is limited to 100 categories and 5,000 command invocations per run. A partial-capture notice means some timings may be missing, including after cancellation or a timeout. Older calls may have no command timings. Capture does not record command inputs, outputs or variable values.

Command categories show available cumulative timings. Nested command durations can overlap, so these are not shares of the workflow's total time.
Audit shows future successful covered workspace changes with the member, action, resource and time. Filter by date, actor ID, action or resource type. More filters also provides a resource-ID filter. Select Created to switch between newest and oldest first. Open resource is available for supported resources that can still be opened.
Covered changes include:
Saving builder edits, publishing, restoring a version, reverting edits and deleting a saved version.
Creating, updating or removing supported endpoints, events, functions, middleware, tables, pages and components, and changing global values.
Adding or verifying managed table indexes, removing indexes, and creating, editing or deleting table triggers. A successful index verification can appear even when an existing matching index needed no change.
Changing middleware defaults, general settings, or the workspace name or environment label.
Workspace creation and deletion are outside this audit coverage. Changes to customer records in your tables are also outside it.
Audit recording is best effort. It does not add older changes, cover every action, record edits to your app's customer records, or provide a complete compliance record. Entries contain change metadata, rather than saved values, credentials or before-and-after snapshots, and expire after 30 days. A missing entry does not prove that no change occurred.
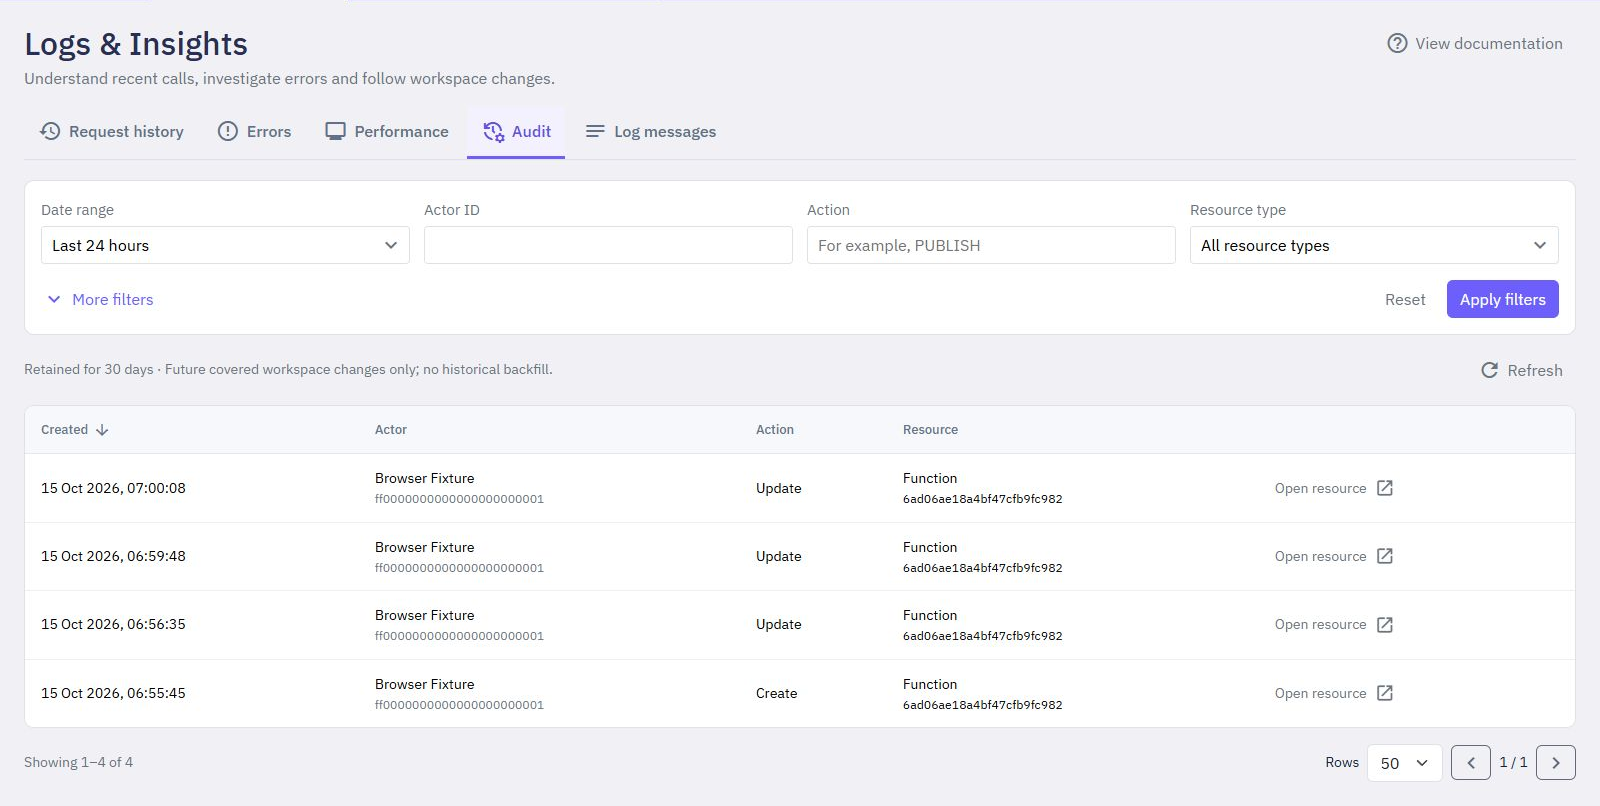
The Audit tab shows covered workspace activity from this feature onward, with filters for member, action and resource.
Log messages helps you search the messages your workflows have recorded. Use the builder's Log command to record useful progress, such as which stage a workflow reached. INFO suits general progress and ERROR suits a problem needing attention. Your existing retained messages remain available.
Start with a recent date range, such as the last hour or last 24 hours. Recent presets follow elapsed time, including when the clock changes. For Custom dates, enter the start and end in the time zone shown next to the filters. Log messages includes the selected end time. During a clock change, a custom time that occurs twice uses the earlier occurrence; use a recent preset when you need an exact elapsed window across that change.
Use Search messages to find literal text, such as validation failed. You do not need a query language or special search symbols. Choose a level to focus on errors, warnings or progress messages. Open More filters to narrow the results to an exact path or trace ID, or exclude unwanted text and field values. Apply the filters to search all matching retained messages in that window, rather than only the current page.
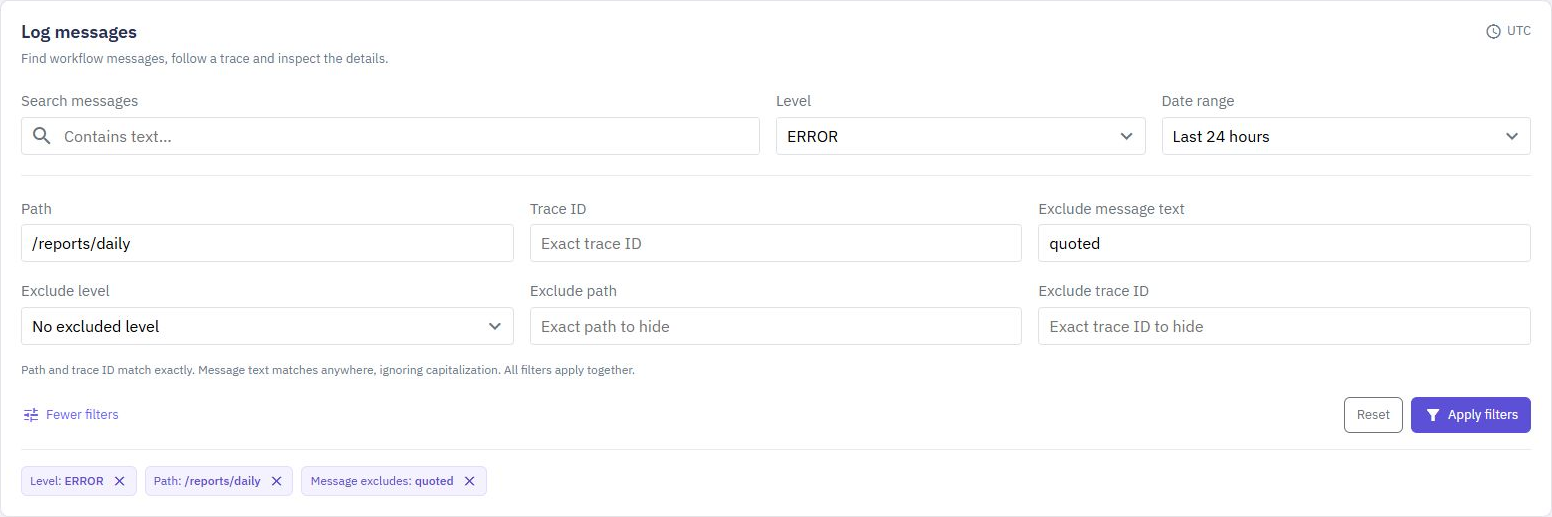
Use More filters to combine a level, exact path and excluded message text. Chips keep the current filter choices visible. Select Apply filters after editing them.
Remove an active filter to widen the results, or reset the filters to start again. A path or trace filter matches the whole value: copying a trace ID from an expanded message is a convenient way to investigate related activity. A matching total is the number of messages satisfying the filters; it is not your plan's request usage.
Select a message's details arrow to read the full text and its available path and trace ID. Use the copy buttons when you need to reuse the message or trace. Turn Wrap lines on to preview up to four lines per message; turning it off keeps rows to one line. Expanded details always show the full message. Text resembling markup is displayed as text.

Expanded details show the complete message, precise time, level, path and available trace ID. Copy message copies the full text, including content beyond the row preview.
Sort by time to switch between newest and oldest first. Choose 20, 50 or 100 rows and use the page controls to move through matching results. The optional Fields view lists values from the current page, with counts for that page only. Use its include or exclude actions to refine the server-side search. These counts do not describe all messages in your workspace.
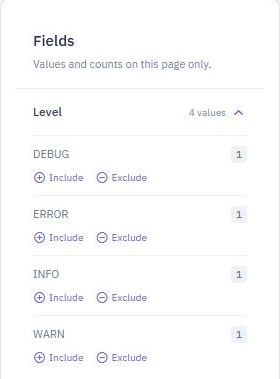
The Fields panel counts the values on this page. Choose Include or Exclude beneath a value to narrow the matching messages.
Refresh when you want the latest matches. Optional Auto-refresh checks every 10 seconds while you review the first page; it pauses when the page is hidden, you have unapplied filter edits, or you are reading another result page. It is off initially. This reloads retained messages rather than replaying any workflow.
When a test uses isolated test data, its custom Log messages appear in the test results rather than the workspace's retained log-message list. This also means View related log messages can be empty for that test even when its test results contain messages. Choose live data only when you intend the test to use and potentially change real workspace resources.
Keep messages short and avoid passwords, tokens or private customer details. Log messages are distinct from grouped error states: marking a group fixed does not delete its messages or history.
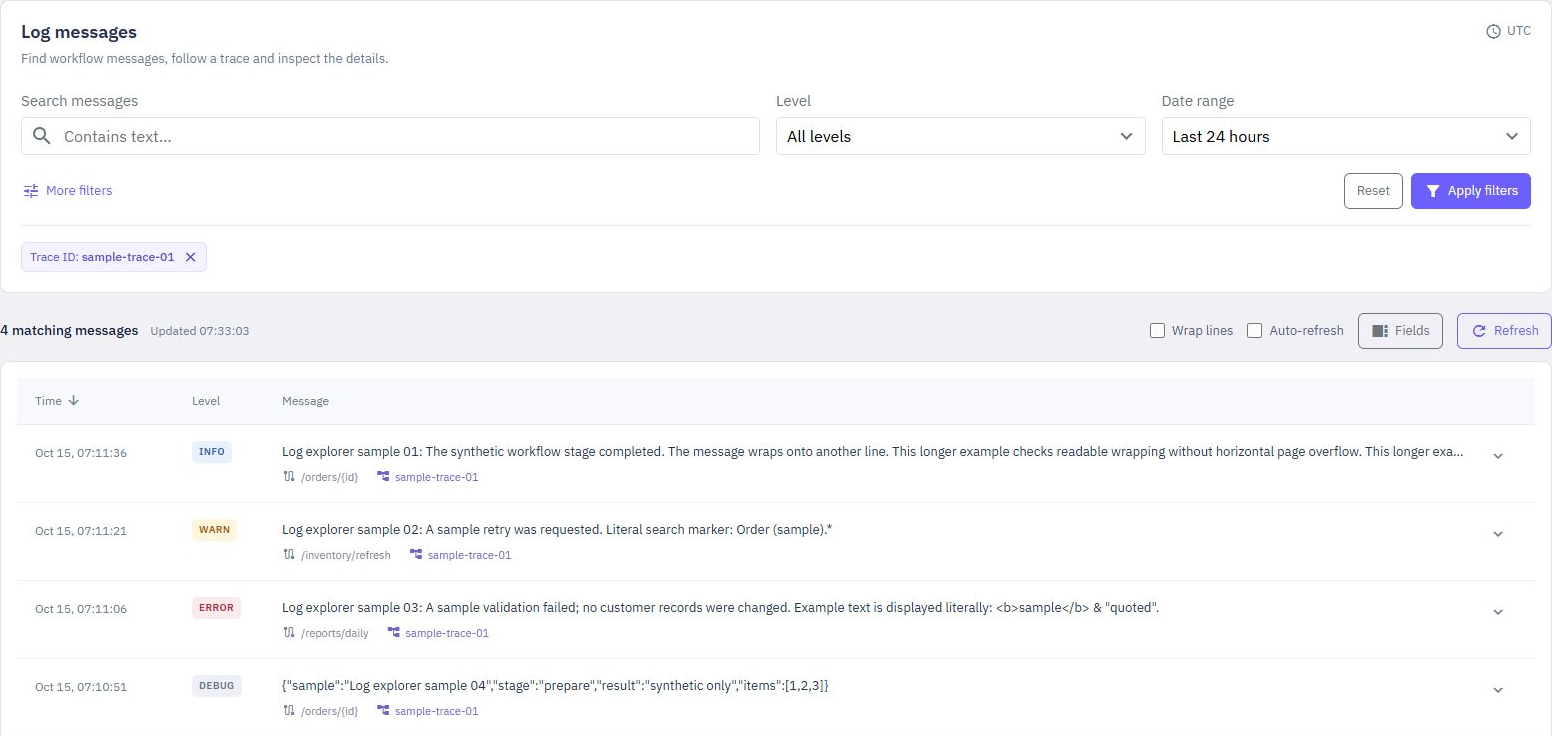
This example follows four messages sharing one trace. Level badges and compact previews keep the list readable. Use Wrap lines for longer previews, or expand a message for the full text. Fields provides values from the current page for further filtering.
If a monitoring tab is empty, check the current workspace, date range and Live/Test choice before widening the filters. Monitoring is advisory: incomplete or expired records are not a reliable way to calculate billing usage.