The Dashboard on Twidget is designed to provide a comprehensive overview of your API usage, storage consumption, and easy access to various resources. Below are the key features of the dashboard:
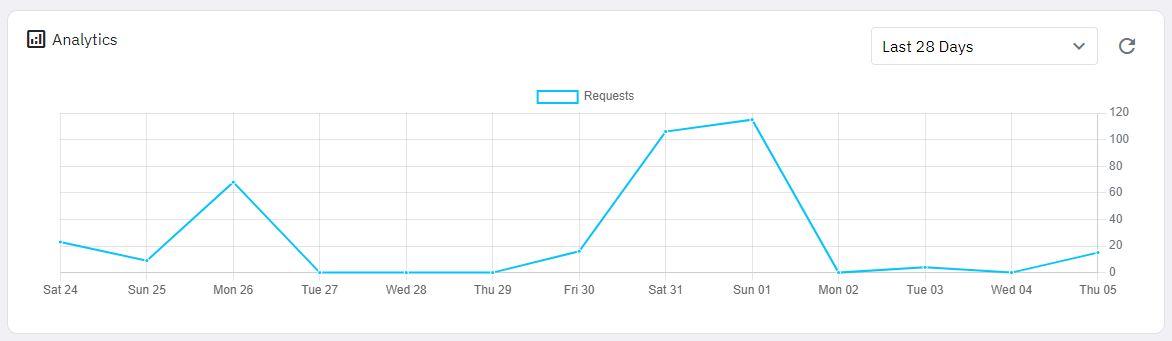
You can view detailed analytics regarding the requests made to your API. The graph can be customized to show data for the following date ranges:
Today
Yesterday
Last 7 days
Last 28 days
Last 90 days
Custom date range
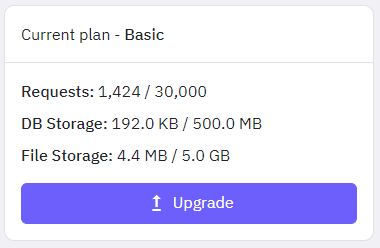
The dashboard displays information about your current organization's plan, including:
Subscription Plan: Details about your current subscription plan.
API Requests: The number of requests made during the current subscription period.
Database Storage: The amount of database storage used out of the allocated quota.
File Storage: The amount of file storage used out of the allocated quota.
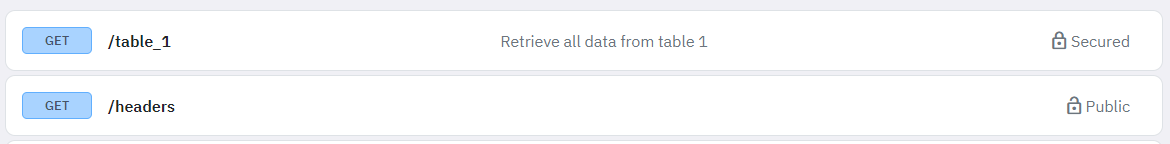
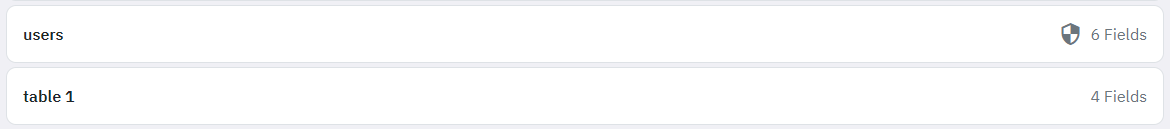
For ease of use, the dashboard provides quick access to:
First 5 API Endpoints: Quick links to the first 5 API endpoints you have created.
First 5 Database Tables: Quick links to the first 5 database tables in your project.
To further assist you, the dashboard includes helpful links to:
YouTube Channel: Watch tutorial videos on our YouTube channel.
Documentation Site: Access extensive documentation for deeper insights and troubleshooting.
Organization Basics
Organizations provide a space where multiple workspaces and APIs can be created. Users have the flexibility to belong to multiple organizations, allowing them to segregate development efforts for various teams or companies. Each organization operates independently, and resources are not shared betwe...
AI Resource Generation & Editing
Twidget includes AI tools that help you generate and edit backend resources by describing what you want in plain language. You can use AI to work with: - Endpoints - Database tables - Reusable functions - Events AI Resource Generator. The AI Generator creates new resources from a text description of...
Workspace Basics
In Twidget, a workspace serves as a dedicated environment for creating resources that contribute to an API's development. An organization can have multiple workspaces, each capable of creating a single API. Within a workspace, you can create the following resources: - [Endpoints](/docs/api/endpoint-...